DBDOC Online Help
Learn about DBDOC
Documentation
- Hyperview
- Running Hyperview
- Managing Project Files and Locating Original Documents
- About DBDOC project files (.dbdoc and .M14)
- Closing the project file
- Finding the original file location of a topic built into the project file
- Importing user data files from a different project
- Opening a project file
- Opening recent project files
- Viewing the Hyperlink compiler version and project file build date and contents
- Basic Hyperview Browser Functionality
- Basic Browsing
- Bookmarks
- Basic Display Settings
- Printing Topics in Hyperview
- Changing print settings
- Marking a topic or group of topics for printing
- Marking the current topic for printing
- Modifying page layout settings for printing
- Printing documents with text annotations on them
- Printing marked topics
- Batch printing marked topics
- Printing the current topic
- Printing with initialized settings (Fast Print)
- Copying text from Hyperview
- Getting Help
- Panes and Hotspots
- Navigation and Signal Tracing in Hyperview
- Signal Tracing
- Clicking on hotspots in the content pane
- Double-clicking on hotspots
- Going to a selected use of a value
- Going to the source of a value
- Highlighting the signal lines associated with a block
- Showing the tree of ancestors for a block visually (Input Tree)
- Showing the tree of descendants for a block visually (Output Tree)
- Browsing to the Next or Previous Topic in a Topic Group
- Browsing to the Next or Previous Use of a Value
- Searching the System and Navigating Search Results
- Clearing Search Hits
- Highlighting search hits
- Search For Selection
- Searching document titles for a topic
- Searching for a block or tag in the database
- Searching the system for a word or phrase
- Viewing next hit in a search result topic
- Viewing previous hit in a search result topic
- Viewing previous search result in a full text or database search
- Viewing search results
- Viewing the next search result in a full text or database search
- Zooming on Documents
- Finding Coordinates on Documents
- Visual Indicators on Documents
- Signal Tracing
- Live data in Hyperview
- Monitoring live data related bandwidth, memory, disk usage and connection status
- Live Data Configuration in Hyperview
- Displaying live data directly on documents
- Showing Live Data for Specific Blocks With Live Loop Annotations
- Adding a live loop annotation to the watch window
- Live Data Options For This Block dialog
- Changing the appearance of live loop annotations
- Copying live loop annotations
- Creating live loop annotations
- Deleting live loop annotations
- Editing live loop annotations
- Finding a live loop annotation if you forget which document it is on
- Interpreting text and symbols on live loop annotations
- Moving a live loop annotation to a different document
- Positioning live loop annotations
- Importing live loop annotations
- Showing Live Specs for a Block
- Trending live data for blocks in the Watch Window
- Managing Groups of Blocks in the Watch Window
- Adding groups to the Watch Window
- Creating a group automatically from a Function Block
- Copying a block from one group to another
- Deleting groups in the Watch Window
- Hiding groups in the Watch Window
- Exporting a Watch Window group definition
- Importing a Watch Window group definition
- Importing a block list to the Watch Window
- Managing Data Collection in the Watch Window
- Pausing and unpausing data collection for entire watch groups
- Pausing data collection automatically in the Watch Window
- Printing the data plot from the Watch Window
- Renaming groups in the Watch Window
- Setting the autopause schedule for all blocks in a group
- Setting the update interval for a group of blocks in the Watch Window
- Managing Blocks in the Watch Window
- Adding a block to a group
- Adding a live loop annotation to the watch window
- Automatically generating the best range for plots in the Watch Window
- Changing the update interval for blocks and groups in the Watch Window
- Deleting a block from the Watch Window
- Editing a block in the Watch Window
- Pausing data collection for a block in the Watch Window
- Saving the current plot vertical range as the custom range
- Setting the update interval for a block in the Watch Window
- Rearranging blocks in the Watch Window
- Linking to Documents Outside the Watch Window
- Controlling Data Display in the Watch Window
- Navigating Watch Window data with the Navigation Timestrip
- Setting the plot font size
- Automatically generating the best range for plots in the Watch Window
- Changing plot line colors in the Watch Window
- Changing the horizontal or vertical plot resolution
- Changing the update interval for blocks and groups in the Watch Window
- Inverting the y-axis of plots in the Watch Window
- Setting a plot display start time
- Preventing pink-colored out of range data from appearing on Watch Window plots
- Showing/Hiding a plot line in the Watch Window
- Stopping the plot from scrolling in the Watch Window
- Understanding when data points are connected with lines in trend plots
- Viewing the Watch Window as one plot or split plots
- Managing Data Collection in the Watch Window
- Managing Data Collection in the Watch Window
- Pausing and unpausing data collection for entire watch groups
- Pausing data collection automatically in the Watch Window
- Pausing data collection for a block in the Watch Window
- Setting the autopause schedule for a block
- Setting the autopause schedule for all blocks in a group
- Setting the default autopause schedule
- Setting the update interval for a block in the Watch Window
- Setting the update interval for a group of blocks in the Watch Window
- Watch Window Autopause Schedule dialog
- General Watch Window Management
- Managing Data in the Watch Window
- Marking Times with Timestamps in the Watch Window
- Managing Groups of Blocks in the Watch Window
- Error Browser
- Text Annotations
- Changing the appearance of text annotations
- Copying a text annotation
- Creating a text annotation
- Deleting a text annotation
- Editing a text annotation
- Importing text annotations
- How to find a text annotation if you forget which document it's in
- How to move a text annotation to a different document
- Positioning and resizing a text annotation
- Unicode control characters for text annotations
- Customizing the Browser Display
- Special Pages and Indexes
- Table of Contents: Master index of all resources, indexes, databases, and reports
- Databases
- System Information and Reports
- Configuration
- Loop Index
- PCU Index
- Module Index
- Graphical Block Map
- Module:List of Unconfigured Tags
- Module:List of Unused Alarm Tags
- Module: Blocks with No Source Named in Databases
- Module: Blocks with No Source in Configuration
- Module: Blocks with No Source used in Graphics
- Module: List of Unused Tags
- Module Block Index (all blocks used within a module)
- Module Block Map
- Module Header
- Module Reference Index
- Module Tag Index
- Module Function Block Index
- Module Variable Index
- Module Verify File
- Reference Index
- Block Use Index (all uses of block within the system)
- Ladder Logic Files
- Hyperview Tools and Windows
- Managing live loop and text annotations in the Annotation Manager
- Viewing the resources used in a drawing with the Audit Window
- Cross Reference Window
- Exporting graphics cross references
- Exporting a database of project data
- About the Watch Window
- About the Error Browser
- Showing the graph for an F(x) block
- User data files
- Hyperview Menus and Toolbars
- Hyperview Browser
- Hyperview Main Menu
- File
- New Window– Launching a new copy of Hyperview
- Open... – Opening a project file
- Close – Closing the project file
- Page Setup– Modifying page layout settings for printing
- Print...– Printing the current topic
- Fast Print... – Printing with initialized settings
- Print Marked Topics... – Printing selected topics
- Mark Topic For Printing... – Selecting the current topic for printing
- Print Annotated Topics... – Printing documents with annotations attached
- Import User Data Files... – Importing user data files after project renaming
- Export Graphics Xref Data... – Exporting graphics cross references
- Export Project Data... – Exporting a database containing project data
- Recent Project Files – Opening recent project files
- Exit – Exiting Hyperview
- Edit
- Bookmark
- Go
- Home – Going to the home page specified for the index and content panes
- Synch Table of Contents – Moving the table of contents to feature the topic in the content pane
- Table Of Contents – Restoring the document's general table of contents
- Display Cross References – Cross referencing graphics
- Back – Going back in the browser history
- Forward – Going forward in the browser history
- Link to Previous Index Entry – Linking to the previous index entry
- Link to Next Index Entry – Linking to the next index entry
- Previous Search Result – Viewing previous search result in a full text or database search
- Next Search Result – Viewing the next search result in a full text or database search
- Previous Search Hit in Topic – Viewing previous search hit in a search result topic
- Next Search Hit in Topic – Viewing next search hit in a search result topic
- Browse to Previous Topic – Browsing to previous topic in topic group
- Browse to Next Topic – Browsing to next topic in topic group
- Find Coordinate... – Finding a specific coordinate in a document
- Search
- View
- Refresh - Redraws the screen
- Change Pane Orientation - Changing the pane orientation in the browser
- Switch to Opposite Pane – Switching focus to the other pane
- Split Adjust – Adjusting the dividing line between panes
- Full Screen - Viewing full screen mode
- Audit Window... Viewing the resources used in a drawing
- Watch Window... – Opening the Watch Window to trend data for one or more blocks
- Error Browser... – Opening the Error Browser to examine error reports
- Search Results... – Viewing search results
- Manage Annotations... – Managing and editing annotations
- Table Of Contents As Tree – Viewing the table of contents in tree format
- Zoom In – Zooming in on a drawing
- Zoom Out – Zooming out of a drawing
- Zoom Toggle – Switching between zoomed and unzoomed views
- Specs – Showing/hiding function code specs
- Attributes/Tag Names – Showing/hiding tag names and attributes
- Document rotation – Rotating the display of PDF and AutoCAD documents
- Live Loop Display – Monitoring data for all outputs on display
- Live Loop Snapshot – Capturing live data
- Display Logic States – Displaying logic state labels directly on live values
- Display Error Markers – Showing/hiding error markers
- Enable Live Specs – Enabling fetching and display of live spec values
- Clear Input/Output Trees – Clearing input and output trees
- Clear Highlighted Signal Lines – Clearing highlighted signal lines
- Highlight
- Options...
- Help
- Contents... – Using Hyperview help
- Index... – Viewing the help index
- Search For Help On... – Searching Hyperview help
- Project File Build Revision... – Viewing the current project file build date and Hyperlink version
- About... – Learning about this version of Hyperview
- Go to GMCL help website – Quick link to help at gmcl.com
- File
- Hyperview Toolbar
- Toolbar quick reference guide– View a summary of all the toolbar commands on one page.
- Print...– Printing the current topic
- Home – Going to the home page specified for the index and content panes
- Table Of Contents – Restoring the document's general table of contents
- Synch Table of Contents – Moving the table of contents to feature the topic in the content pane
- Display cross references – Viewing a cross reference of system graphics
- Browse to previous topic – Browsing to the previous topic in topic sequences
- Browse to next topic – Browsing to the next topic in topic sequences
- Link to previous index entry – In a point index, goes to the previous hyperlink in sequence
- Link to next index entry – In a point index, goes to the previous hyperlink in sequence
- Browse back – Goes back to the previous topic in the history list
- Browse forward – Goes forward to the next topic in the history list
- Change pane orientation – Toggles the viewing areas between Side-by-Side, Upper-Lower, and Full-screen format
- Zoom in – Doubles the magnification of the drawing in the topic pane
- Zoom out – Decreases the magnification of the drawing by a factor of two
- Zoom toggle – Switching between zoomed and unzoomed views
- Search – This button can be toggled between Full Text Search, Database Search, and Topic Title Search
- Previous search hit – Goes to the previous result of the full text or database search
- Next search hit – Goes to the next result of the full text or database search
- Previous highlight in topic – Scrolls to the previous search hit in the topic
- Next highlight in topic – Scrolls to the next search hit in the topic
- Creating a text annotation – Creates an annotation anywhere in the content pane
- Creating live loop annotations – Creates a live loop annotation anywhere in the content pane
- Managing annotations – Opens the manage annotations window
- Watch Window – Opens the live data watch window
- Error Browser – Opens the error browser
- Audit Window – Opens the audit window
- Add Bookmark – Allows you to tag the current topic with a meaningful name
- Live Loop Display – To monitor the live data continuously for all the outputs on the display
- Live Loop Snapshot – Hyperview will send out a request to fetch the values of the outputs displayed
- Hyperview Right-Click Popup Menus
- General Popup Menu
- Help... – Using Hyperview help
- Search For Selection – Searching for a selected topic
- Copy Selection – Copying selected text to the clipboard
- Text Annotation – Creating a text annotation
- Live Loop Annotation – Creating live loop annotations in the context menu
- Specs – Showing/hiding function code specs
- Attributes/Tag Names – Showing/hiding tag names and attributes
- Graphs – Showing the graph for an F(x) block
- Highlight – Highlighting items in Hyperview
- Show Thumbnail Images – Showing thumbnail images in the index pane
- Audit Window... – Viewing the resources used in a drawing
- Set Zoom Factor – Setting the zoom factor
- Find Coordinate – Finding a specific coordinate in a document
- Rotate Clockwise/Counterclockwise – Rotating graphics
- Go To Block Map – Viewing the block map
- Bookmark This Page... – Bookmarking a selected topic
- Mark For Printing – Marking a topic for printing
- Make This Topic My Content/Index Pane Home Page – Setting the home page
- Document – Finding the original file location of a topic built into the project file
- Hotspot Popup Menu
- Help... – Using Hyperview help
- Function Code Documentation (PDF) – External function code documentation
- Search For Selection – Searching for a selected topic
- Copy Selection – Copying selected text to the clipboard
- Create Text Annotation for this Block – Creating a text annotation
- Create Live Loop Annotation for this Block – Creating live loop annotations
- Add This Block to the Watch Window – Adding a block to a group
- Show Function Graph for Block – Showing the graph for an F(x) block
- Show Live Specs For This Block – Showing live specs
- Go To Source – Going to the source of a value
- Go To Use – Going to a selected use of a value
- Go To Block Map – Viewing the block map
- Mark For Printing – Marking a topic or block index for printing
- Function Block Popup Menu
- Help about... – Getting function code help and documentation
- Function Code Documentation (PDF) – External function code documentation
- Search For Selection – Searching for a selected topic
- Copy Selection – Copying selected text to the clipboard
- Create Text Annotation – Creating a text annotation
- Show Live Function Graph – Showing the graph for an F(x) block
- Show Live Specs For This Block – Showing live specs
- Add Standard Inputs and Outputs to Watch Window – Create a group from a function block
- Show Input/Output Tree – Showing the tree of ancestors for a block visually
- Function Code Popup Menu
- Signal Line Popup Menu
- Thumbnail Popup Menu
- General Popup Menu
- Hyperview Main Menu
- Watch Window
- Watch Window Main Menu
- File
- Group
- Add... – Adding a group to the Watch Window
- Import... – Importing a block list to the Watch Window
- Manage... – Hiding groups in the Watch Window
- Rename – Renaming Watch Window groups
- Delete – Deleting Watch Window groups
- Pause All Blocks – Pausing and unpausing entire watch groups
- Autoscale All Blocks – Automatically generating the best range for plots in the Watch Window
- Set Update Interval for All Blocks...
- Set Autopause Schedule for All Blocks...
- Block
- Add... – Adding a block to a group
- Copy to Group – Copying a block from one group to another
- Edit... – Editing a block in the Watch Window
- Delete – Deleting a block from the Watch Window
- Save Current Range as Custom Range – Saving the current plot vertical range as the custom range
- Go To Source – Going to the source of a value
- Go To Block Map – Viewing the block map
- Show – Showing/Hiding a plot line in the Watch Window
- Pause Data Collection – Pausing data collection for a block in the Watch Window
- Autoscale Mode – Automatically generating the best range for plots in the Watch Window
- Reverse Y-axis – Inverting the y-axis of plots in the Watch Window
- Change color... – Changing the color of plots in the Watch Window
- Change schedule...
- View
- Options
- Help
- Watch Window Toolbar
- View Mode– Putting the Watch Window into crosshairs cursor mode
- Select Mode– Putting the Watch Window into data selection mode
- Export Data – Exports data from the Watch Window to Excel or other programs
- Delete Data – Deletes portions of data from the Watch Window
- Print Group – Prints the data plot from the Watch Window
- Add Group – Adds a group of blocks to the Watch Window
- Import Group – Imports a group of block to the Watch Window
- Add Block – Adds an individual block to the Watch Window
- Edit Block – Edits a block in the Watch Window
- Delete Block – Deletes an individual block from the Watch Window
- One Plot – Shows live data on one single plot
- Split Plot – Shows live data on a separate plot for each block
- Watch Window Right-Click Popup Menus
- Plot Popup Menu
- Group Tab Popup Menu
- Add Block – Adds an individual block to the Watch Window
- Add Group – Adding groups to the Watch Window
- Import Group – Importing a block list to the Watch Window
- Rename Group – Renaming groups in the Watch Window
- Delete Group – Deleting groups in the Watch Window
- Pause All Blocks – Pausing and unpausing data collection for entire watch groups
- Autoscale All Blocks – Automatically generating the best range for plots in the Watch Window
- Set Update Interval for All Blocks – Setting the update interval for a group of blocks in the Watch Window
- Set Autopause Schedule for All Blocks – Setting the autopause schedule for all blocks in a group
- Block List Popup Menu
- Add Block – Adding a block to a group
- Copy to Group – Copying a block from one group to another
- Edit – Editing a block in the Watch Window
- Delete – Deleting a block from the Watch Window
- Save Current Range as Custom Range – Saving the current plot vertical range as the custom range
- Go To Source – Going to the source of a value
- Go To Block Map – Viewing the block map
- Show – Showing/Hiding a plot line in the Watch Window
- Pause Data Collection – Pausing data collection for a block in the Watch Window
- Autoscale Mode – Automatically generating the best range for plots in the Watch Window
- Reverse Y-axis – Inverting the y-axis of plots in the Watch Window
- Change color – Changing the color of plots in the Watch Window
- Change schedule – Setting the autopause schedule for a block
- Timestamp Popup Menu
- Other Watch Window Buttons and Fields
- Watch Window Main Menu
- Hyperview Browser
- Keyboard Shortcuts
- Known issues
- Hyperview in a Browser
- Setting up a Hyperview Service
- Running the Hyperview Service Controller
- Configuring your Hyperview Services setup
- Adding or modifying a Hyperview Service
- Starting and stopping Hyperview Services from the command line
- Accessing Hyperview Services through a firewall
- Managing Hyperview Service log files
- Finding Hyperview Service user data files
- Managing user accounts
- Using Hyperview in a Browser
- Hyperview in a Browser Menus and Toolbars
- Hyperview in a Browser
- Hyperview in a Browser Main Menu
- Hyperview in a Browser Toolbar
- Menu – Opening the menu
- Home – Displaying your home page in the browser
- Table of Contents – Displaying the main Table of Contents
- Sync Table of Contents – Synchronizing the index pane to the pane with focus
- Full Text Search – Searching for a word or phrase
- View Search Results – Displaying the results of the last search
- Select Browse Mode – Toggling between document and search result browsing modes
- Previous Topic – Browsing to the previous topic in a topic group
- Next Topic – Browsing to the next topic in a topic group
- Previous Index Entry – Browsing to the previous entry in an index
- Next Index Entry – Browsing to the next entry in an index
- Previous Search Result – Displaying the previous search result
- Next Search Result – Displaying the next search result
- Previous Search Hit – Showing the previous hit in a search result topic
- Next Search Hit – Showing the previous hit in a search result topic
- Live Loop Display – Displaying live data on a document (updated periodically)
- Live Loop Snaphot – Displaying live data on a document (updated when needed)
- Hyperview in a Browser
- Setting up a Hyperview Service
- Function Codes
- [ADD]: Matrix Addition [FC169]
- [X]: Matrix Multiplication [FC170]
- >: High Select [FC10]
- <: Low Select [FC11]
- A-INT: Manual Set Integer [FC52]
- A-REAL: Manual Set Constant [FC51]
- A: Manual Set Constant (Signal Generator) [FC2]
- ADAPT: Adapt [FC24]
- AI/B: Analog Input (Periodic Sample) [FC25]
- AI/DEF CBC: Analog Input Definition [FC182]
- AI/I: Analog Input/Cnet [FC121]
- AI/L: Analog Input/Loop [FC26]
- AI: Analog Input [FC27]
- AIL/B: Analog Input List (Periodic Sample) [FC63]
- AIL/CW: Analog Input List/CW800 (Periodic Sample) [FC205]
- AIS/FBS: Analog Input/Slave [FC132]
- AND 2: AND (2-Input) [FC37]
- AND 4: AND (4-Input) [FC38]
- AO/B: Analog Output (Same PCU Node) [FC28]
- AO/L: Analog Exception Report [FC30]
- AO: Analog Output [FC29]
- AOLDB: Analog Exception Report with High/Low Alarm Deadband [FC48]
- APID: Advanced PID Controller [FC156]
- ASCII STDESC: ASCII String Descriptor [FC113]
- ASIO/L: Analog Input Exception Report [FC47]
- ASNAP: Analog Segment Buffer [FC163]
- ASO/L: Analog Point Definition [FC70]
- ASO: Analog Output/Slave [FC149]
- ATREND: Trend Definition [FC78]
- AUX DIG UDF: Auxiliary Digital User Defined Function [FC199]
- AUX REAL UDF: Auxiliary Real User Defined Function [FC198]
- BASBO: BASIC Boolean Output [FC94]
- BASBOQ: C or BASIC Program Boolean Output With Quality [FC138]
- BASCFG: BASIC Configuration (BRC-100/200) [FC91]
- BASRO: BASIC Real Output [FC93]
- BASROQ: C and BASIC Program Real Output With Quality [FC137]
- BCDIN: BCD Input [FC114]
- BCDOUT: BCD Output [FC115]
- BHIST: Batch Historian [FC220]
- BLINK: Blink [FC61]
- BMUX: Boolean Signal Multiplexer [FC119]
- BSEQ: Batch Sequence [FC148]
- CALCMD AMM 2/3: Calibration Command [FC74]
- CALDB AMM 2/3: Calibration [FC73]
- CALLOC: C Allocation [FC144]
- CALST AMM 2/3: Analog Calibration Status [FC75]
- CFC Allocation: CFC Allocation [FC254]
- CISI/O: Control Interface Slave [FC79]
- CMM: Condition Monitoring [FC247]
- CSEQ: Common Sequence [FC219]
- DAANG: Data Acquisition Analog [FC177]
- DAANGI/L: Data Acquisition Analog Input/Loop [FC178]
- DADIG: Data Acquisition Digital [FC211]
- DADIGI/L: Data Acquisition Digital Input/Loop [FC212]
- DATA EXPT: User Defined Data Export [FC194]
- DATAIMPT: User Defined Data Import [FC193]
- DDRIVE: Device Driver [FC123]
- DEL PID: PID Control (PV and SP) [FC19]
- DELAY: Time Delay (Analog) [FC58]
- DEVMON: Device Monitor [FC125]
- DI/B: Digital Input (Periodic Sample) [FC41]
- DI/I: Digital Input/Cnet [FC122]
- DI/L: Digital Input/Loop [FC42]
- DI: TCS Digital Input [FC43]
- DIGDEF: Slave Default Definition [FC128]
- DIGRP: Digital Input Group [FC84]
- DIL/B: Digital Input List (Periodic Sample) [FC64]
- DIL/CW: Digital Input List/CW800 (Periodic Sample) [FC206]
- DIL: Digital Input List [FC46]
- DIVIDE: Divide [FC17]
- DLS: Digital Logic Station [FC88]
- DLSI: Digital Logic Station Interface [FC87]
- DO/L: Digital Exception Report [FC45]
- DO: TCS Digital Output [FC44]
- DOBUFF: Digital Output Buffer [FC49]
- DOGRP: Digital Output Group [FC83]
- DOLDB: Digital Exception Report with Alarm Deadband [FC67]
- DOREAD: Digital Output Readback Check [FC100]
- DSNAP: Digital Segment Buffer [FC162]
- DSOE SEM-MFP: DSOE Data Interface [FC241]
- DSOE: DSOE Digital Event Interface [FC242]
- DSUM: Digital Sum With Gain [FC65]
- DTF: General Digital Controller [FC157]
- EAID: Enhanced Analog Input Definition [FC216]
- EASD: Enhanced Analog Slave Definition [FC215]
- EASO/L AMM03: Enhanced Analog Point Definition [FC158]
- ECC: Enhanced Calibration Command [FC217]
- ETIMER: Elapsed Timer [FC86]
- ETREND: Enhanced Trend [FC179]
- EXEC AMM 2/3: Executive Block NAMM02/IMAMM03 [FC71]
- EXEC AMM1: Executive Block (NAMM01) [FC56]
- EXEC CBC: Batch Executive (CBC) [FC183]
- EXEC COM: Executive Block (COM) [FC53]
- EXEC CSC: Sequence Executive [FC175]
- EXEC GCM: Plant Loop Gateway Executive [FC130]
- EXEC IIT: Remote Transfer Module Executive Block (INIIT12) [FC202]
- EXEC LMM2: Executive Block (IMLMM02) [FC105]
- EXEC LMM: Executive Block (NLMM01) [FC54]
- EXEC MFC/P: Executive [FC81]
- EXEC REMOTE INF-PL: INIPT02 Executive Block [FC203]
- EXECSL AMM 2/3: Analog Slave Definition [FC72]
- EXEXEC LMM2: Extended Executive (IMLMM02) [FC108]
- EXEXEC MFC/P: Extended Executive [FC90]
- EXP: Exponential [FC172]
- F(X): Function Generator [FC1]
- F(t): Lead/Lag [FC3]
- FCS: Frequency Counter/Slave [FC145]
- FDD: Foreign Device Definition [FC228]
- FIP AI: Analog Input Subscriber [FC186]
- FIP AO: Analog Output Subscriber [FC187]
- FIP DI: Digital Input Subscriber [FC185]
- FIP DO: Digital Output Subscriber [FC188]
- FIP SH: Factory Instrumentation Protocol Handler [FC184]
- GATEWAY: Gateway [FC227]
- GIO LMM2: Group I/O Definition(IMLMM02) [FC107]
- GPDEF: Plant Loop Gateway Point Definition [FC131]
- GRPI/O LMM: Group I/O Definition [FC60]
- H//L: High/Low Compare [FC12]
- H/L LIM: High/Low Limiter [FC6]
- HSS03: Hydraulic Servo [FC55]
- HSS: Hydraulic Servo Slave [FC150]
- I/O CBC: Batch Input/Output [FC180]
- IDPDEF: Data Point Definition [FC201]
- IND: Indicator Station [FC20]
- INFGCM EXEC: INFI-NET to Plant Loop Local Transfer Module Executive Block (INIPT01) [FC200]
- INPOL: Interpolator [FC168]
- INTEG: Integrator [FC166]
- INVBAS: Invoke BASIC [FC92]
- INVKC: Invoke C [FC143]
- IOC/AIN: Analog In/Channel [FC222]
- IOC/AOUT: Analog Out/Channel [FC223]
- IOC/DIN: Digital In/Channel [FC224]
- IOC/DOUT: Digital Out/Channel [FC225]
- IOC/PIN: Pulse In/Channel [FC229]
- IOD/DEF: I/O Device Definition [FC221]
- ISCCON: ISC Parameter Converter [FC153]
- JUMP (MCR): Jump/Master Control Relay [FC116]
- LAST BLOCK: Last Block [FC89]
- LOG: Logarithm [FC174]
- M/A (BASIC): Manual/Auto BASIC Station [FC21]
- M/A (CAS): Manual/Auto Cascade Station [FC22]
- M/A (RATIO): Manual/Auto Ratio Station [FC23]
- M/A CBC: Batch Station (CBC) [FC181]
- M/A CSC: Sequence Station (CSC) [FC176]
- M/A MFC/P: Control Station [FC80]
- M/A SLC: Strategic Loop Controller Station [FC231]
- MODST: Module Status Monitor [FC95]
- MODST: Module Status Monitor/CW800 [FC207]
- MOVAVG: Moving Average [FC165]
- MSDVDR: Multistate Device Driver [FC129]
- MULTI MON: Multi-Sequence Monitor [FC134]
- NODE STAT: Node Statistics Block [FC57]
- NOT: Not [FC33]
- ON/OFF: Manual Set Switch [FC50]
- OR 2: OR (2-Input) [FC39]
- OR 4: OR (4-Input) [FC40]
- PAREST: Model Parameter Estimator [FC152]
- PARSCH: Adaptive Parameter Scheduler [FC154]
- PHASEX: Phase Execution [FC218]
- PID: PID Error Input [FC18]
- PIDUR: Pulse Input/Duration [FC109]
- PIFREQ: Pulse Input/Frequency [FC103]
- PIPER: Pulse Input/Period [FC102]
- PITOT: Pulse Input/Totalization [FC104]
- POLY AMM03: Polynomial Adjustment [FC159]
- POLY: Polynomial [FC167]
- POWER: Power [FC173]
- PSI: Passive Station Interface [FC139]
- PTSST: Analog Point Service Status [FC77]
- PULPOS: Pulse Positioner [FC4]
- PULSE: Pulse Rate [FC5]
- Plant Loop Gateway Node Map [FC127]
- QOR: Qualified OR (8-Input) [FC36]
- RATE LIM: Rate Limiter [FC8]
- RCM: Remote Control Memory [FC62]
- RDEMUX: Real Signal Demultiplexer [FC126]
- RECIPB: Boolean Recipe Table [FC117]
- RECIPR: Real Recipe Table [FC118]
- REDAI: Redundant Analog Input [FC96]
- REDDI: Redundant Digital Input [FC97]
- REGRES: Regression [FC155]
- REMSET: Remote Manual Set Constant [FC68]
- RESTR: Restore [FC140]
- RI/OD: Remote I/O Definition [FC147]
- RI/OI: Remote I/O Interface [FC146]
- RMC: Remote Motor Control [FC136]
- RMUX: Real Signal Multiplexer [FC120]
- RNG10: Rung (10-Input) [FC111]
- RNG20: Rung (20-Input) [FC112]
- RNG5: Rung (5-Input) [FC110]
- S R: Memory [FC34]
- S: Summer (4-Input) [FC14]
- SEGCRC: Segment Control (IMCOM04) [FC164]
- SEGCRL: Segment Control Block [FC106]
- SEGCRM: Segment Control [FC82]
- SEQGEN: Sequence Generator [FC161]
- SEQMGR: Sequence Manager [FC135]
- SEQMON: Sequence Monitor [FC124]
- SEQMST: Sequence Master [FC141]
- SEQSLV: Sequence Slave [FC142]
- SLC I/O: Strategic Loop Controller I/O [FC230]
- SLSEL: Slave Select [FC98]
- SMART: Smart Field Device Definition [FC133]
- SMITH: Inferential Smith Controller [FC160]
- SNMP Monitor: SNMP Monitor [FC249]
- SOE DEF: Addressing Interface Definition [FC244]
- SOE EXEC: Executive Block (SEM01/11) [FC243]
- SOE INP: Input Channel Interface [FC245]
- SOE TRIG: Trigger Definition [FC246]
- SOE/S: Sequence of Events Slave [FC210]
- SOELOG: Sequence of Events Log [FC99]
- SQRT: Square Root [FC7]
- SUM(K): Summer (2-Input) [FC15]
- T-DIG: Digital Transfer [FC59]
- T-INT: Integer Transfer [FC13]
- T: Analog Transfer [FC9]
- TD-DIG: Timer [FC35]
- TEST STATUS: Test Status [FC226]
- TEXT: Text Selector [FC151]
- TIOD: Turbine I/O Device Definition [FC248]
- TREND: Analog Trend [FC66]
- TRIG: Trigonometric [FC171]
- TRIP: Trip [FC32]
- TSTALM: Test Alarm [FC69]
- TSTQ: Test Quality [FC31]
- TUTEMP AMM 2/3: Thermocouple Temperature [FC76]
- UDF1: User Defined Function One [FC191]
- UDF2: User Defined Function Two [FC192]
- UDFDEC: User Defined Function Declaration [FC190]
- UP/DN: Up/Down Counter [FC85]
- X: Multiply [FC16]
- XOR: Exclusive OR [FC101]
- BuildPlus
- Running BuildPlus
- Using a dongle
- Using a DBDOC license and computer key
- Exiting BuildPlus
- Opening BuildPlus
- Learning about this version of DBDOC
- Running scheduled builds
- Using command line options
- Customizing the BuildPlus user interface
- Showing main process window, sub-process window, or both
- Showing process windows tiled or cascaded
- Displaying the project name in BuildPlus title bar (Global option)
- Changing warning about space on build disk drive
- Minimizing the sub-process window during decomposer and hyperlink runs (Global option)
- Resetting to show any suppressed dialogs during the build (Global option)
- Refreshing BuildPlus
- Managing BuildPlus Projects
- BuildRoots
- BuildPlus projects
- Creating a new project or opening an existing project
- Opening a recent project
- Deleting a project
- Renaming a project
- Moving a project
- Cloning a project
- Importing a project
- Exporting a project
- Reverting to a previous build
- Revising the location of your databases, graphics and other files
- Recovering projects that BuildPlus can't find
- Cleaning up temporary/intermediate files
- Changing project options
- Creating Project Settings Archive
- Exploring to project files
- Configuring a Project
- Specifying the project name and system file specifications
- Specifying configuration, graphics and other file locations with the Configuration Wizard
- Building in AC 800M
- Building in 800xA graphics
- Building in Symphony Plus graphics
- Building in PPB graphics
- Building in Conductor NT graphics
- Building in SODG graphics
- Resolving duplicate file choices
- Conductor NT or PPB Console associations
- Symbols-Graphics Association
- Database-Graphics Association
- Changing included databases
- Changing project options
- Resolving non-accessible path/file
- Categorizing SODG graphics
- Building a DBDOC Project
- Starting a build or rebuild
- Stopping a build
- Running partial builds
- Setting process priority (Build Root option)
- Modifying PI database point sources
- Using Custom Edit
- Defining blocks with external sources and enabling live loop monitoring of those blocks
- Finding more tags in Sibling Projects
- Launching Wordpad to edit the .CFG file before Hyperlink run
- Executing partial matching search for tagnames in text on AutoCAD and DXF files
- Including Cabinet drawings in .CLT files
- Re-including previously excluded files
- New module header files auto-detection
- New graphics folders auto-detection
- Excluding some graphics files
- Setting the DataCode page value
- Using User Defined Scripts
- About BuildPlus processing
- Understanding BuildPlus processing messages
- Build Results
- Project Files (.dbdoc)
- Renaming project files from BuildPlus
- Changing how project files will be named (Build Root option)
- Choosing locations for copying project files after the build
- Exporting data from .dbdoc files
- Excluding Symbols and SubModels chapters from build
- Making Composer references more readable on CLD sheets by unstacking
- Inserting live loop settings to be automatically built into subsequent project files
- Archiving incomplete snapshot.dbdoc files when a build fails
- Modifying Error Markers Display
- Fetching live data for no source blocks
- Adding sections to Table of Contents Other Documentation
- Understanding DBDOC errors
- Modifying Management of Change options
- Comparing builds using WinMerge
- Project Files (.dbdoc)
- Getting Help in BuildPlus
- Contacting GMCL
- Choosing Help from the BuildPlus Main Menu
- Using ? button on dialog boxes
- BuildPlus Menus and Toolbars
- BuildPlus Main Menu
- File
- Edit
- Build
- View – Showing main process window, sub-process window, or both
- Window – Showing process windows tiled or cascaded
- Tools
- Create Compressed File of Error/Debug Files – Choosing to automatically generate an error.7z file (Creating a compressed file of error/debug files)
- Launch Windows Explorer
- Launch Hyperview – Viewing a project file
- Compare with WinMerge – Comparing builds using WinMerge
- Refresh BuildPlus – Refreshing BuildPlus
- DBDOC License – Using a DBDOC license and computer key
- Check Dongle Driver – Checking, installing and uninstalling dongle drivers
- ErrFilter – Running errfilter
- Short build from CFG Stage – Running a short build from cfg stage
- Run Wizard for Configuration
- Project Options
- Processing Options
- User Defined Scripts – Running a script before, during and/or after the build
- DataCode Page Value – Setting the DataCode page value
- Launch Project Options after Wizard run – Choosing to launch Project Options after Wizard
- Outdated Sources – Choosing whether to show the old source detected query dialog
- Rebuild project immediately upon closing project options pages – Choosing to rebuild immediately after closing Project Options
- Advanced Options
- Launch Wordpad to edit the .CFG file before Hyperlink run – Launching Wordpad to edit the .CFG file before Hyperlink run
- Exclude Symbols and SubModels chapters from build – Excluding Symbols and SubModels chapters from build
- Unstack Composer References – Making Composer references more readable on CLD sheets by unstacking
- Execute partial matching search for tagnames in text on AutoCAD and DXF files – Executing partial matching search for tagnames in text on AutoCAD and DXF files
- Process databases in order of descending number of tags – Processing databases in order of descending number of tags
- Use .CLT files in Composer for cabinet drawings – Including Cabinet drawings in .CLT files
- Modify Error Markers Display
- Fetch Data For All Blocks
- Copy the final .DBDOC file to the following locations – Choosing locations for copying project files after the build
- Shared Data Folder Location – Choosing a folder for shared files for Hyperview users
- Exporting data from .dbdoc files
- Define Blocks with External Sources – Defining blocks with external sources and enabling live loop monitoring of those blocks
- Finding more tags in Sibling Projects
- Excluded Files – Re-including previously excluded files
- Live loop/CIUMon settings – Inserting live loop settings to be automatically built into subsequent project files
- Custom Edit – Using Custom Edit
- Database Selections – Changing included databases
- Setting the SODG Graphics type for each graphics directory – Categorizing SODG graphics
- PI Database Point Sources – Modifying PI database point sources
- Management of Change Processing – Modifying Management of Change options
- Symbols-Graphics Association – Symbols-Graphics Association
- Database-Graphics Association – Database-Graphics Association
- Processing Options
- Conductor NT/PPB Console Association – Conductor NT or PPB Console associations
- Check Extracted Directory Sources – Checking extracted directory sources
- Rename .DBDOC/.M14 Document – Renaming projects file from BuildPlus
- Build Root Options
- Log Build Messages – Logging messages from the main window (Build Root Option)
- Run in Diagnostic/Maintenance Mode – Running the build in Diagnostic/Maintenance Mode (Build Root option)
- Automatically clean up files upon completion of build – Automatically cleaning up files upon completion of build (Build Root option)
- Archive project Error Files – Archiving project error files (Build Root option)
- Archive Snapshot.dbdoc on failure – Archiving incomplete snapshot.dbdoc files when a build fails (Build Root option)
- Create project Registry Archive – Creating project registry archive (Build Root option)
- Set Process Priority (non-GUI and MediaView compiler) – Setting process priority (Build Root option)
- Automatic rename of Snapshot.DBDOC – Changing how project files will be named (Build Root option)
- Always use available program in the Overrides directory for builds – Choosing to use programs in the Overrides directory for builds (Build Root option)
- Automatically generate error.7z file – Automatically generating error.7z file (Build Root option)
- Set code page value for the Buildroot – Setting code page value for the Buildroot (Build Root option)
- Save .dbdoc file to a separate location and delete from project directory
- Global Options
- Project Name in BuildPlus Title Bar – Displaying the project name in BuildPlus title bar (Global option)
- Warn if less than ___MB left on build disk drive – Changing warning about space on build disk drive
- Minimize sub-process window during decomposer and hyperlink runs – Minimizing the sub-process window during decomposer and hyperlink runs (Global option)
- Suppress progress bars – Suppressing progress bars (Global option)
- WinMerge Open option – Comparing next or previous project's file or directory (Global option)
- Sibling Projects – Deselecting Sibling Projects (Global option)
- Minimum Chapters (to add sections to Table of Contents Other Documentation)
- Reset to show all suppressed dialogs – Resetting to show any suppressed dialogs during the build (Global option)
- Displaying Project Settings and Selections
- Enumerate DBDOC Components – Creating a file listing all DBDOC components in the Application Data folder
- Export Project – Exporting a project
- Import Project – Importing a project
- Rename Current Project – Renaming a project
- Move Current Project – Moving a project
- Clone Current Project – Cloning a project
- Revert to a Previous Build – Reverting to settings used in a previous build
- Revising the location of your databases, graphics and other files
- Recover Projects – Recovering projects that BuildPlus can't find
- Help
- Contents – Using BuildPlus help
- Index – Viewing the BuildPlus help index
- Search for Help on – Searching BuildPlus help
- Go to GMCL help website – Visit the online help documentation
- Command Line Help – See how to build your project from the command line
- Display BuildPlus .nod file location
- DBDOC License – Using a DBDOC license and computer key
- About BuildPlus – Learning about this version of DBDOC
- BuildPlus Toolbar
- Build – Starts a complete build of the current project, without changing any of the project settings
- Pause Buildall after current project
- Stops the current build
- View .DBDOC/.M14 Document – View a project file
- Project Wizard – Starts the build from the project wizard
- System File Specifications – Starts the build from the system file specifications dialog, allowing you to chance all the settings for the project
- WinMerge Current Project – Compares current project's file or directory
- WinMerge Open Previous Project – Compares previous project's file or directory
- WinMerge Open Next Project – Compares next project's file or directory
- Launch Windows Explorer
- What's This? - to obtain help on the BuildPlus interface, click this button, then click the item you need help with
- BuildPlus Main Menu
- Running BuildPlus
- Build Reports
- Error reports
- General build reports
- FCnnn.DBF - Extracted specifications from CAD and CLD files
- SPEC.MDB - Used to link the files in an Access database
- BLOCKS.DBF contains block, function code and reference information
- File_statistics.csv, contains information about the files built into the .dbdoc file
- F(X)_Specs.txt - List of interesting function generator specifications
- FCList.txt - List of the number of instances of each function code
- TagUsage.tsv - Summary of tags used in the system
- Emptyfiles.txt - Shows source files that were empty
- Blank_CAD.txt - Shows CAD files and CLD sheets that were empty
- New_tags.txt - A list of all new tags that have been added since the last build
- Tags_in_graphics.dbf - A database with a record for each tag in each graphic
- Unused Tag Lists - List of tags that are not in any graphic
- Extracted and synthesized "flattened" databases
- Global taglists - A master tag list with all the tags in the system
- Unused_symbols.txt - This file lists symbols that are unused by the graphics
- Significant Change Report
- Undefined tags
- Undefined graphics
- Undefined symbols
- pg2_unidentified_record_types.txt
- Management Of Change (MOC)
- Error summary reports
- DBDOC.ERR - A log of the entire build
- DBDOC.ERR.UNI - A unicode version of DBDOC.ERR
- DBDOC_RESIDUAL.ERR - Any messages that are not included in our documented error messages
- DBDOC_SUMMARY.ERR - Composed of every file that had errors
- DBDOC_RESIDUAL.TXT - A copy of the most recent DBDOC_RESIDUAL.ERR
- DBDOC_SUMMARY.TXT - A copy of the most recent DBDOC_SUMMARY.ERR
- Individual errors
- 800xA color not found [INTERNAL 201]
- Adapt block adapts previous block [CHECK 118]
- Adapt block does not exist [ERROR 014]
- Adapt block: Adapted block does not exist [ERROR 021]
- Adapt block: Not used [ERROR 019]
- Adapt block: Spec out of range [ERROR 020]
- Adapt type mismatch [ERROR 169]
- Adapted block on other page [CHECK 044]
- Adapted coordinates out of order [INFO 032]
- Adapted rung spec [INFO 061]
- AlarmVector tag has case mismatch - tag is in table [ERROR 138]
- AlarmVector tag has case mismatch - tag is not in table [ERROR 139]
- AlarmVector tag is not defined in any database associated with console [ERROR 140]
- Ambiguous wiring [ERROR 121]
- APID block illegal decrease flag [ERROR 086]
- APID block illegal increase flag [ERROR 085]
- APID old algorithm and inhibit inputs [ERROR 087]
- Assertion failed [INTERNAL 080]
- Attempted ADAPT block redefinition [ERROR 176]
- Bad CAD magic number [INTERNAL 002]
- Block adapts a block that is already adapted [ERROR 117]
- Block not wired from same function code [CHECK 186]
- Block number on unwired input [COSMETIC 098]
- Block number too high [ERROR 322]
- Block out of range [ERROR 167]
- Blocks have been overlaid [CHECK 225]
- Bogus source for block zero [BUILD 180]
- Both 0 and 1 have same descriptor [CHECK 064]
- Broken connection [ERROR 345]
- Building multiple 800xA consoles into one project file not yet supported [INTERNAL 200]
- CADNames cannot be opened [ERROR 10044]
- Can't find ProgID for GUID-named dependency [INTERNAL 203]
- Can't open DBF file RESOLVE.DBF [BUILD 10001]
- Cannot determine target [CHECK 347]
- Cannot import error database [INTERNAL 289]
- Choosing description for XRefObjID [CHECK 10029]
- Circular inhibit [CHECK 181]
- Circular reference [CHECK 184]
- Circular symbol inclusion [CHECK 182]
- Circular symbol inclusion of tag [CHECK 183]
- CLD file has not been recompiled. [INFO 10022]
- Completely unconnected wire [ERROR 340]
- Connection to unconfigured variable [ERROR 342]
- Connection wired in Composer only [INTERNAL 170]
- Connection wired in drawing only [INTERNAL 171]
- Continuous exception reports generated [ERROR 145]
- Control character in tag description [INFO 323]
- Could not locate batch include file [BUILD 252]
- Couldn't open font file [BUILD 192]
- DAANG alarm control not an integer [ERROR 090]
- DAANG both de-alarm and return alarm [ERROR 089]
- DAANG illegal alarm control [ERROR 088]
- DAANG suspicious alarm period [ERROR 091]
- Data type mismatch [ERROR 094]
- Database has no records [ERROR 290]
- Descriptor empty [CHECK 015]
- Digital in Alarm Group cannot alarm [CHECK 078]
- DIOFCSpec associated with unknown FC [INFO 10014]
- Discarding description for XRefObjID [CHECK 10030]
- Display not found [CHECK 197]
- Display with GUID not found [CHECK 198]
- Displayed tag has no source - module not built [ERROR 266]
- Document defined in another chapter [INFO 188]
- doVector called with non-string second argument [INTERNAL 244]
- doVector() called with numeric 2nd argument [INTERNAL 243]
- Duplicate global OREF [CHECK 190]
- Duplicate local OREF [CHECK 296]
- Duplicate source [ERROR 092]
- Duplicate station tag [INFO 189]
- Duplicate tag in database [ERROR 103]
- Dynamic definition undefined [INTERNAL 277]
- EbVector references unknown graphic [CHECK 216]
- Element outside configured bounds [INTERNAL 202]
- Enhanced trend has illegal S2 value [ERROR 024]
- Enhanced trend: S1 wired from wrong function code [ERROR 025]
- Error count exceeded [BUILD 60000]
- External output reference is unreachable [ERROR 10015]
- External output reference not found [CHECK 10008]
- F(x) discontinuity (step) [CHECK 031]
- F(x) graph is flat [INFO 035]
- F(x) graph is flat (unwired) [COSMETIC 036]
- F(x) uses large values and may not clamp output [ERROR 034]
- Failed to locate field indices -- not a database? [BUILD 220]
- Failed to locate field name [BUILD 221]
- Failed to open file [BUILD 006]
- Failed to read header [BUILD 001]
- Failed to read library directory [INTERNAL 013]
- Failed to read record [INTERNAL 004]
- Failed to reseek to start [INTERNAL 005]
- FC126 S3 Exceeds 4 Linked Blocks [ERROR 318]
- FC225 S5 must be 1 for FC228 [ERROR 311]
- Fewer fields than substitutions [BUILD 222]
- File contains a space in its name [COSMETIC 213]
- File version unknown [INTERNAL 271]
- Font file not found [BUILD 191]
- Frozen import block [ERROR 093]
- Function block chain loop [ERROR 325]
- Function block disabled [ERROR 297]
- Gain spec is adapted [INFO 119]
- Got lost parsing file [INTERNAL 10007]
- Graphic link target is null [INTERNAL 291]
- Harmony I/O block illegally wired [ERROR 095]
- History tag references tag not in database [ERROR 253]
- Ignoring adapted Block 0 [ERROR 082]
- Illegal adapt block, spec 3 is 0 [ERROR 116]
- Illegal import (not exception-reported) [ERROR 129]
- Illegal import (type mismatch) [ERROR 131]
- Illegal import (different loop) [ERROR 130]
- Illegal import (full status ignored) [CHECK 132]
- Illegal module value [INTERNAL 066]
- Illegal spec value: should be 0 or 1 [ERROR 149]
- Illegal spec value: Spec S7 from 0 - 100 [ERROR 146]
- Import from same PCU [ERROR 128]
- Import information [ERROR 255]
- Import Module Status is wired but non-functional [CHECK 174]
- Import out of range [ERROR 336]
- Imported block has no source - module not built [ERROR 265]
- Included image was not found [CHECK 294]
- Inconsistent LPM data [ERROR 10020]
- Increasing drawing height [COSMETIC 023]
- Increasing drawing width [COSMETIC 022]
- Inhibit tag not found [ERROR 348]
- Input list attempts to import nonexistent block 9999 [ERROR 334]
- Input list attempts to import out-of-range block 9999 [ERROR 335]
- Input list imports block 9999 [CHECK 333]
- Input wiring expected - Harmony [CHECK 187]
- Inputs have been overlaid [CHECK 226]
- Integrator disabled by spec value [ERROR 298]
- Internal error: get_block() non-block tag [INTERNAL 049]
- Internal error: Unknown hotspot [INTERNAL 016]
- Invalid block number on line [INTERNAL 246]
- Invalid CAD file: Too short [INTERNAL 010]
- Invalid CAD file: Zero length [INTERNAL 009]
- Invalid header or bad magic number [INTERNAL 10011]
- Invalid loop number for block [INTERNAL 247]
- Invalid loop: high byte used [INTERNAL 248]
- Invalid record length [INTERNAL 003]
- IREF does not have an input [ERROR 096]
- IREF GlobalIRef import mismatch [INFO 10019]
- IRef not found in IRefRes table: set to blank [INTERNAL 10013]
- IRef not found in IRefRes table: skipping [INTERNAL 10012]
- Legacy err message [INTERNAL 10005]
- Legacy fatal message [INTERNAL 10006]
- Legacy warning message [INTERNAL 10004]
- Library missing [COSMETIC 026]
- Linked Block Already Linked [ERROR 317]
- Linked Block Connected To Self [ERROR 319]
- Linked Block Has Wrong FC [ERROR 316]
- Live wire not connected [CHECK 199]
- Loop out of range [ERROR 164]
- M1 display file not found (not configured) [CHECK 195]
- Macro is present in multiple libraries [INFO 10031]
- Mismatched tagname [CHECK 205]
- Mismatched tagname (not in database) [CHECK 204]
- Missing associated file [INTERNAL 285]
- Missing definitions file [INTERNAL 292]
- Missing dynamic target [INTERNAL 275]
- Missing graphic target [INFO 314]
- Missing LBR Report [INTERNAL 000]
- Missing M1 not defined [CHECK 267]
- Missing string introducer [INFO 10040]
- Missing symbol or sub-model [BUILD 099]
- Module mismatch: does not match module in file [ERROR 10021]
- Module mismatch: does not match Module in file -- skipping [ERROR 10038]
- Module out of range [ERROR 166]
- More than one input to connector [ERROR 106]
- Multilevel alarms disabled [ERROR 062]
- Multiple slave FCs [ERROR 153]
- Multiple slave FCs: Too many FC 132's [ERROR 155]
- Multiple slave FCs: Too many FC 149's [ERROR 154]
- Multiple targets [ERROR 328]
- Multiple TSTALM [ERROR 084]
- Multiple wires at source: assuming connector [COSMETIC 219]
- Negative block number [CHECK 037]
- Negative string length [INFO 10041]
- Nested inhibit [CHECK 069]
- Never found library file [COSMETIC 011]
- No SHAPE.LBR was found [BUILD 012]
- No source: Imported block not found [ERROR 110]
- No source: Other [ERROR 113]
- No source: Used in display [ERROR 111]
- No source: Verify [COSMETIC 112]
- No tag database specified for console [BUILD 108]
- No valid sections found in XDC file [BUILD 109]
- No wired input [COSMETIC 097]
- Node out of range [ERROR 165]
- Non-local exit called -- CLD resolution [INTERNAL 10043]
- Non-local exit called at offset [INTERNAL 10042]
- Non-local exit from file [INTERNAL 060]
- Non-orthogonal rotation [INTERNAL 038]
- Non-orthogonal shear rotation [ERROR 327]
- Not enough inputs [ERROR 133]
- Only handling first tag [CHECK 048]
- OREFs differ in case only [CHECK 185]
- Out of expected range [ERROR 10026]
- Outdated file format [INTERNAL 206]
- Override on input [INFO 122]
- Override on output: forced to a constant [INFO 151]
- Override on output: held [INFO 150]
- Override on output: invalid code [INFO 152]
- Parse error in file [INTERNAL 115]
- PDF security prevents embedding [BUILD 324]
- PID block uses derivative with PV from discontinuous input [ERROR 307]
- PID Controller has all active tuning constants zero [ERROR 173]
- PID Controller has primary gain spec zero [ERROR 172]
- PID lag spec zero [CHECK 177]
- Point has no description [COSMETIC 251]
- Possibly corrupt GPI mdb File [ERROR 315]
- Possibly corrupt HGS mdb File [CHECK 320]
- Possibly corrupt HPG mdb File [CHECK 321]
- Problem communicating with dongle [INTERNAL 045]
- QOR forced to 1 [INFO 135]
- QOR used as a NOR [INFO 134]
- Record failed to find matching format [INTERNAL 210]
- REDAI both inputs same block [CHECK 072]
- REDAI deadband exceeds rate limit [CHECK 075]
- REDAI invalid deviation S4 [CHECK 074]
- REDAI quality is never tested [CHECK 175]
- REDAI select input hardwired [CHECK 073]
- REDAI select input wired but ignored [CHECK 079]
- REDDI both inputs from same block [CHECK 076]
- REDDI select input hardwired [CHECK 077]
- Referenced M1 display file not found [CHECK 194]
- Regex compilation error [INTERNAL 039]
- Regex execution error [INTERNAL 040]
- REMSET limits out of order [ERROR 261]
- Requested color index out of range [INTERNAL 193]
- RESTR block order wrong [ERROR 065]
- RESTR block will never save [ERROR 309]
- RESTR block will update to NVRAM every cycle [INFO 308]
- Rung block did not use all inputs to compute output [ERROR 127]
- Rung block spec is unwired but used [ERROR 125]
- Rung block spec is wired but unused [ERROR 124]
- Rung block spec is wired from constant [ERROR 126]
- Rung stack not initialized [ERROR 306]
- Same-bus input cannot read value in other loop [ERROR 10016]
- Same-bus input cannot read value in other PCU [ERROR 10017]
- Same-loop input attempts to read value in other loop [ERROR 10018]
- Segment control block auto-sequencing enabled [INFO 302]
- Segment control block bad priority [ERROR 300]
- Segment control block check cycle time [ERROR 303]
- Segment control block checkpoint period is too small [ERROR 304]
- Segment control block duplicate priority [ERROR 301]
- Skipping file: Error parsing submodel [INTERNAL 055]
- Skipping file: File contains no records [INTERNAL 059]
- Skipping file: File too short [INTERNAL 058]
- Skipping file: OpenDesign Exception [INTERNAL 052]
- Skipping file: Possibly corrupt A/B PLC file [INTERNAL 057]
- Skipping file: Unable to read file [INTERNAL 054]
- Skipping file: Unknown M1/M2 file type [INTERNAL 056]
- SODG aliasing error [ERROR 160]
- Source in same module [ERROR 157]
- Source wired to another source [ERROR 158]
- Span is zero for dynamic bar [COSMETIC 231]
- Spare block used in downstream wiring [CHECK 168]
- Spec input index out of range [ERROR 018]
- Spec is illegally adapted [ERROR 083]
- Specification out of valid range [ERROR 299]
- SQLite bind error [INTERNAL 208]
- SQLite error [INTERNAL 081]
- SQLite error [INTERNAL 207]
- SQLite FTS Indexing Batch Failed [ERROR 313]
- SQLite FTS Indexing Failed [ERROR 312]
- ST parse error [INTERNAL 346]
- Station span * PID gain greater than 125.0 [INFO 179]
- Station span * PID gain less than 80.0 [INFO 178]
- Symbol flag detection failed [INTERNAL 287]
- System error total exceeded [BUILD 60001]
- Tag atom not upper case [CHECK 264]
- Tag failed to find matching format [INTERNAL 209]
- Tag index not found [ERROR 159]
- Tag index not found [ERROR 272]
- Tag index not found in database [ERROR 123]
- Tag mismatch [ERROR 101]
- Tag name not found in any database [ERROR 067]
- Tag name not upper case [ERROR 263]
- Tag not an exception report [ERROR 256]
- Tag not found by name [INTERNAL 293]
- Tag not found in any database [ERROR 284]
- Tag not found in correct database [ERROR 288]
- Tag not found where specified [ERROR 068]
- Tag referenced in PNT database has no LPMB info [COSMETIC 250]
- Tag renames block [ERROR 144]
- Tag type mismatch [ERROR 102]
- Tag used in graphic not exception-reported [ERROR 141]
- Tag/trend mismatch [ERROR 105]
- TagAtom mismatch [CHECK 229]
- Tagname is illegal in PCView [ERROR 104]
- Tested block on different page [CHECK 211]
- Tokenization unrecognized [INTERNAL 269]
- Too big for float [ERROR 10027]
- Too big for short: integer value [ERROR 10009]
- Too big for unsigned short [ERROR 10024]
- Too many fields [INTERNAL 223]
- Too many outputs [ERROR 137]
- Too many segment control blocks [ERROR 305]
- Too many tag databases for tagmap [BUILD 249]
- Too small for float [ERROR 10028]
- Too small for short [ERROR 10023]
- Too small for unsigned short [ERROR 10025]
- Trend block is wired from constant [COSMETIC 258]
- Trend block not used on any graphics or archived [CHECK 257]
- Trend definition file not found [CHECK 196]
- Trend does not have matching tag in any associated database [ERROR 107]
- Trend index (tag) does not reference a trend in any associated trend database [ERROR 142]
- Trend index does not reference a trend in any associated trend database [ERROR 143]
- Trend referenced, but no tags configured in any database [COSMETIC 254]
- Trend tag not found in any database [ERROR 163]
- Trend tag referenced by two tags [ERROR 161]
- Trend tag refers to missing or invalid entry [ERROR 162]
- Trip on fault (defined I/O point bad) [ERROR 148]
- Trip on fault (will trip on failure) [ERROR 147]
- TSTALM checks subsequent block [CHECK 212]
- TSTALM does not test base block [CHECK 310]
- TSTQ on import quality only [CHECK 070]
- TSTQ tests block not propagating quality [ERROR 071]
- TSTQ tests block with no quality [ERROR 063]
- TSTQ tests executive block [CHECK 156]
- Type code cannot be rendered [INTERNAL 278]
- Unable to find bitmap [BUILD 100]
- Unable to parse node [INTERNAL 027]
- Unconnected wire end [ERROR 339]
- Unexpected function code [INTERNAL 017]
- Unhandled calculation [ERROR 326]
- Unhandled complex source configuration [INTERNAL 341]
- Unhandled data after record [INTERNAL 234]
- Unhandled escape type [INTERNAL 236]
- Unhandled line [INTERNAL 237]
- Unhandled LMM spec value [INTERNAL 235]
- Unhandled pe header data [INTERNAL 233]
- Unknown AC 800M block type [INTERNAL 338]
- Unknown access code [INTERNAL 273]
- Unknown atom [CHECK 047]
- Unknown Component Number [INTERNAL 270]
- Unknown dynamic bar direction [INTERNAL 232]
- Unknown Exception [INTERNAL 053]
- Unknown logic state type [INTERNAL 245]
- Unknown picture type in ctx [INTERNAL 218]
- Unknown record type [INTERNAL 240]
- Unknown shape (missing library) [ERROR 042]
- Unknown shape (no user library) [ERROR 041]
- Unknown shape (not in library) [ERROR 043]
- Unknown subtype for block ed 50 [INTERNAL 242]
- Unknown subtype on line [INTERNAL 241]
- Unknown tag type [INTERNAL 259]
- Unknown type code [INTERNAL 276]
- Unrecognized binary data [INTERNAL 274]
- Unreferenced graphic file [INFO 214]
- Unreferenced graphic name [INFO 215]
- Unresolved connection [ERROR 344]
- Unsupported dynamic symbol subtype [INTERNAL 239]
- Unsupported FC used in CFC [ 10045]
- Unsupported function [INTERNAL 238]
- Unsupported graphic primitive [INTERNAL 217]
- Unsupported non-literal tag name [INTERNAL 343]
- Unused extra inputs [INTERNAL 136]
- User macro registered multiple times [INFO 10039]
- Vertical text on drawing [INFO 050]
- Wired gain spec is adapted [INFO 120]
- X coordinate adapted [INFO 029]
- X coordinates out of order [ERROR 033]
- XOR output forced to 0 [CHECK 281]
- XOR output forced to 1 [CHECK 280]
- XOR output forced to complement input [CHECK 283]
- XOR output forced to track input [CHECK 282]
- XOR output forced to track input [CHECK 279]
- Y coordinate adapted [INFO 030]
- Zero gain on input block [CHECK 262]
- Legacy error files
- DBDOC ADAPT BLOCKS.ERR
- DBDOC ADAPT EXECUTE ERROR.ERR
- DBDOC AMBIGUOUS POINT NAMES.ERR
- DBDOC COMPOSER SPECS.ERR
- DBDOC LPM REFERENCE PROBLEM.ERR
- DBDOC MULTIPLE TAG NAMES.ERR
- DBDOC RUNG BLOCK.ERR
- DBDOC TAG INDEX.ERR
- DBDOC TAG MISMATCH.ERR
- DBDOC UNKNOWN TAG.ERR
- DBDOC-BUILD FILE OPEN FAILURE.ERR
- DBDOC-BUILD FONT PROBLEM.ERR
- DBDOC-BUILD MISSING SYMBOL.ERR
- DBDOC-CHECK 800XA SUBMODEL.ERR
- DBDOC-CHECK 800xA DYNAMIC BAR.ERR
- DBDOC-CHECK ALARM VECTOR.ERR
- DBDOC-CHECK BINARY LINKS.ERR
- DBDOC-CHECK CFG FILE TIMESTAMPS.ERR
- DBDOC-CHECK CIRCULAR SUBMODEL INCLUSION.ERR
- DBDOC-CHECK CLD PARSING PROBLEM.ERR
- DBDOC-CHECK DEFAULT SPECS USED.ERR
- DBDOC-CHECK DUPLICATE LABEL.ERR
- DBDOC-CHECK FILE INCLUSION.ERR
- DBDOC-CHECK FUNCTION HOTSPOT.ERR
- DBDOC-CHECK GRAPHICAL EXPRESSION.ERR
- DBDOC-CHECK IGNORED FUNCTION.ERR
- DBDOC-CHECK INCLUDED FILE.ERR
- DBDOC-CHECK INVALID RECORD LENGTH.ERR
- DBDOC-CHECK MISSING DISPLAYS.ERR
- DBDOC-CHECK MS ACCESS WILDCARD CHARACTERS.ERR
- DBDOC-CHECK NO PEN STYLE.ERR
- DBDOC-CHECK NON-TREND BLOCK.ERR
- DBDOC-CHECK POSSIBLY CORRUPT.ERR
- DBDOC-CHECK SIMILAR TAGS.ERR
- DBDOC-CHECK UNEXPECTED END OF BLOCK.ERR
- DBDOC-CHECK UNEXPECTED END OF LINE.ERR
- DBDOC-CHECK UNEXPECTED VALUE.ERR
- DBDOC-CHECK UNKNOWN WONDERWARE VERSION.ERR
- DBDOC-CHECK UNTAGGED TREND BLOCK.ERR
- DBDOC-CHECK VERY LARGE HOTSPOT.ERR
- DBDOC-COSMETIC MULTIPLE WIRES.ERR
- DBDOC-COSMETIC NO WIRED INPUT.ERR
- DBDOC-IGNORE BLANK TAG IN GRAPHIC.ERR
- DBDOC-IGNORE COMPACTING RTF TITLE.ERR
- DBDOC-IGNORE ERROR COMPRESSING FILE.ERR
- DBDOC-IGNORE FILE OPEN FAILURE.ERR
- DBDOC-IGNORE INVALID FILE HANDLE.ERR
- DBDOC-IGNORE INVALID TREND.ERR
- DBDOC-IGNORE LINK TO TAG
- DBDOC-IGNORE LINK TO TAG.ERR
- DBDOC-IGNORE MS ACCESS WILDCARD CHARACTERS.ERR
- DBDOC-IGNORE MULTIPLE DYNAMIC BARS
- DBDOC-IGNORE MULTIPLE DYNAMIC BARS.ERR
- DBDOC-IGNORE PRIMARY DISPLAY.ERR
- DBDOC-IGNORE SCALEMODE.ERR
- DBDOC-IGNORE UNCONNECTED WIRE.ERR
- DBDOC-IGNORE UNIMPLEMENTED.ERR
- DBDOC-INFO MULTIPLE MACROS.ERR
- DBDOC-INFO OVERRIDE.ERR
- DBDOC-INTERNAL 800XA PROCESSING.ERR
- DBDOC-INTERNAL GRAPHIC PRIMITIVE.ERR
- DBDOC-INTERNAL INVALID CAD FILE.ERR
- DBDOC-INTERNAL MESSAGE.ERR
- DBDOC-INTERNAL MISSING 800xA COLOR.ERR
- DBDOC-INTERNAL NON-LOCAL EXIT.ERR
- DBDOC-INTERNAL PG2.ERR
- DBDOC-INTERNAL SKIPPING.ERR
- DBDOC-INTERNAL SPLUS-PGP.ERR
- DBDOC-INTERNAL SQLITE MESSAGE.ERR
- DBDOC-INTERNAL STRANGE ARGUMENTS.ERR
- DBDOC-INTERNAL UNHANDLED ENTITY.ERR
- DBDOC-INTERNAL UNRESOLVED REFERENCE.ERR
- Other error checking techniques
- CIUMon
- Setting up CIUMon
- Installing CIUMon
- Methods of connecting CIUMon to a CIU
- Connecting directly to a CIU
- Connecting to RoviSys Turbo
- Connecting to Harmony OPC Server
- Connecting to a TRAX emulator
- Managing CIUMon configurations
- Getting live data across a network
- Running CIUMon automatically (as a service)
- Running CIUMon manually
- Interacting with CIUMon
- Improving CIUMon's performance
- Managing access to live data
- Restricting access to live data
- Approving or blocking access to live data by a Windows logon name
- Removing a Windows logon name from the list of approved or blocked logon names
- Approving or blocking live data access from a single IP address
- Approving or blocking live data access from a range of IP addresses
- Changing an IP address or range of IP addresses in the list of approved or blocked IP ranges
- Removing an IP address or range of IP addresses from the list of approved or blocked IP ranges
- Tracking who is using live data
- Allowing some users to get more live data than others
- Restricting access to live data
- Troubleshooting CIUMon
- Live data security considerations
- Getting help in CIUMon
- Setting up CIUMon
- CIUMon Service Controller
- CIULink
- Running CIULink
- Running CIULink as a Viewer
- Logging with CIULink
- Loading, Saving and Deleting Tag Lists
- Running from Microsoft® Excel
- Running from Microsoft® Access
- Administering DBDOC
- Installing DBDOC
- Installing the DBDOC build system
- Installing the CIUMon online data server
- Sharing Hyperview and project files over a network
- Installing Hyperview on an individual computer
- Installing the 800xA DLLs for Hyperview support of 800xA graphics
- Installing the DBDOC Demo
- Installing the Assyst tools for extraction of 800xA graphics
- Operating system requirements and installation notes
- Getting installation help
- Installation notes
- The DBDOC kits and their supported operating systems
- DBDOC build system hardware performance requirements
- Working with the DBDOC security dongle
- What happens when I install over a previous version of DBDOC?
- Installing DBDOC on a virtual machine
- Known installation issues
- Updating your DBDOC installation
- Licensing DBDOC
- Installing DBDOC
- Contacting GMCL
- Credits
Live Data Options For This Block dialog
Contents
- 1 About the Live Data Options For This Block dialog
- 2 Selecting the block for which data is to be displayed
- 3 Selecting the module for which Module Status is to be displayed
- 4 Setting the description and update interval
- 5 Data display options for Live Loop Annotations
- 6 Data display options for block in the Watch Window
- 7 General data display options for both Live Loop Annotions and Watch Window blocks
- 8 See also
About the Live Data Options For This Block dialog
The Live Data Options For This Block dialog appears when you create a new live loop annotation, add a point to the Watch Window from within the Watch Window, or choose to edit an existing live loop annotation or Watch Window point. Use it to specify which block you want your live loop annotation or Watch Window to monitor, and to set options for how that block's live data should be displayed.
![]() Note: While the Watch Window and Live Loop Annotation functions share the Live Data Options For This Block dialog, different options are available for each function.
Note: While the Watch Window and Live Loop Annotation functions share the Live Data Options For This Block dialog, different options are available for each function.
Use the Live Data Options For This Block dialog to:
- Choose which block you want to monitor using a live loop annotation or the Watch Window.
- Choose whether to display data in a live loop annotation as a single value or as a bar graph.
- Set the maximum and minimum values that will be displayed on the vertical axis of the Watch Window plot or live loop annotation bar graph.
Selecting the block for which data is to be displayed
Live output data for any block can be displayed in Live Loop Annotations or in the Watch Window.
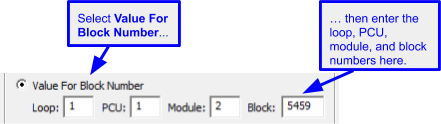
Specifying a block by Loop, PCU, Module, Block
- Select the Value For Block Number option under the Specify Value to Monitor heading.
- Enter the loop, PCU, module, and block numbers in the Value For Block Number boxes.
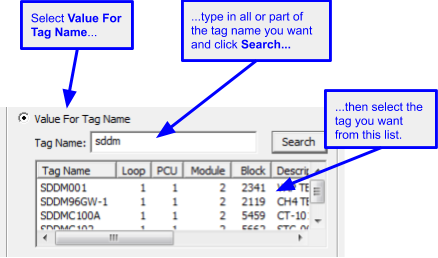
Specifying a block by tag name
- Select the Value For Tag Name option under the Specify Value to Monitor heading.
- Type all or part of the name of the tag you want to monitor in the Tag Name box and click Search.
- Choose the tag you want from the list in the Value For Tag Name box.
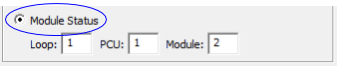
Selecting the module for which Module Status is to be displayed
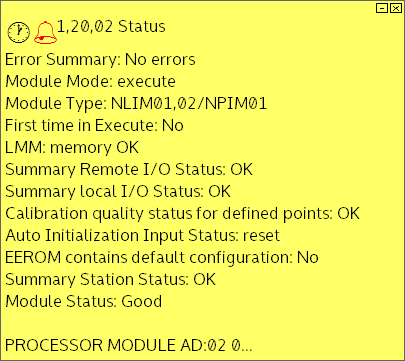
You may also view the status of the module by clicking Module Status in the Live Data Options For This Block dialog. Live module status for any module can be displayed in either Live Loop Annotations or in the Watch Window.
By doing so, the following annotation will be created:
Setting the description and update interval
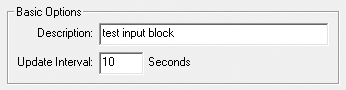
- Description: You can add a description for the block in the Description field. This description will show up in the Watch Window, in mouse-over tooltips, and in the block headers when data is exported.
![]() Note: If you do not enter a description here, Hyperview will try to generate one. The automatically generated description will never overwrite a description that you have entered. To get an automatically generated description after you have entered a description, delete the description that you entered and then close and reopen the Live Data Options For This Block dialog box.
Note: If you do not enter a description here, Hyperview will try to generate one. The automatically generated description will never overwrite a description that you have entered. To get an automatically generated description after you have entered a description, delete the description that you entered and then close and reopen the Live Data Options For This Block dialog box.
- Update Interval: Specify the number of seconds between data fetches for this block.
Data display options for Live Loop Annotations
Displaying live data
Live data is always displayed on the live loop annotation. Prior to 11.1, the option to show live specs instead was displayed. This has been moved for live specs to display directly on top of the static specs. See Enabling fetching and display of live spec values for more information.
The watch window always shows live data.
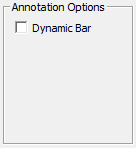
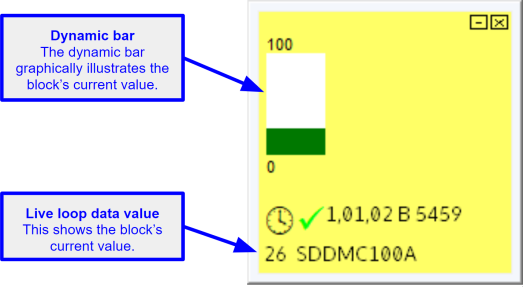
Displaying a dynamic bar
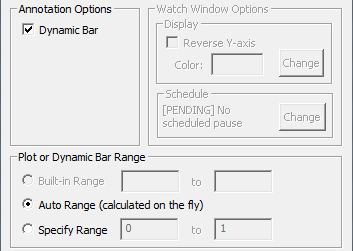
- After selecting Show Live Data for a live loop annotation, you can select the Dynamic Bar to show a bar graph of the data value. By selecting the Dynamic Bar option, the Plot or Dynamic Bar Range will become active. If you do not select Dynamic Bar, the annotation will show only the live data value.
Data display options for block in the Watch Window
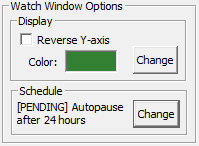
Reversing the Y-axis of the plot for the selected block
Check Reverse Y-Axis to vertically reverse the plot display for the selected block.
Changing the plot line color for the selected block
Click the Change button next to the color swatch to specify a color for the plot line.
Change the autopause schedule for the selected block
Click the Change button next to the schedule summary. Use the Watch Window Autopause Schedule dialog to change the schedule.
Note that if the block is used in multiple places in the Watch Window, and is paused in some places but not others, all instances of the block will continue to update. This is because all the data collected for a single block is consolidated, and is available to all instances of the block even if they are paused.
General data display options for both Live Loop Annotions and Watch Window blocks
Specifying the plot vertical range
- If the block you are monitoring has a built-in range, you can select Built-in Range to have the watch window or live loop annotation bar graph use it.
![]()
Enter the maximum and minimum values you want, respectively, in the text boxes to the right of the Specify Range button.
- Select Auto Range to have the vertical axis of the watch window or live loop annotation bar graph adjust to the live data it receives.
![]()
- Select Specify Range to set the maximum and minimum values that will be displayed on the vertical axis of the watch window or live loop annotation bar graph.
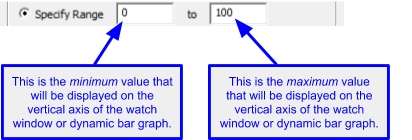
See also
- About live loop annotations
- Adding a live loop annotation to the watch window
- Changing the appearance of live loop annotations
- Copying live loop annotations
- Creating live loop annotations
- Deleting live loop annotations
- Editing live loop annotations
- Finding a live loop annotation if you forget which document it is on
- Importing live loop annotations
- Interpreting text and symbols on live loop annotations
- Managing live loop and text annotations in the Annotation Manager
- Moving a live loop annotation to a different document
- Positioning live loop annotations
DBDOC ©1996 - 2025 G. Michaels Consulting Ltd., all rights reserved. All other trademarks and registered trademarks are the property of their respective holders. Website source largely available under the terms of the AGPLv3.