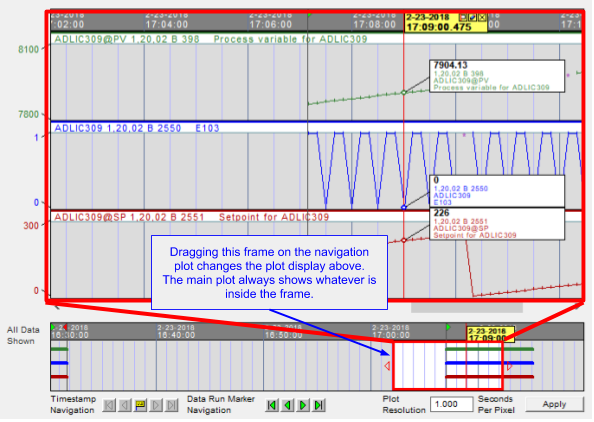
A navigation plot below the main plot makes it easy to move through different datasets collected at different times. This timestrip shows a birds-eye view of the entire plot, not just the portion visible in the plot of the moment. The portion of the plot visible at the moment is surrounded by a red frame in the timestrip navigation plot. The visible area can be changed by dragging the frame left or right on the timestrip navigation plot.

With the Data Run Marker Navigation buttons you can step through data collected at different times. Watch Window data may be collected for short periods widely separated in time. It can be tricky to scroll to exactly the right spot on the plot to view a particular time. The data run markers (small green and red flags) are automatically added to the plot wherever a data run starts or ends (i.e. wherever data was paused or unpaused for a particular block). Using the data run marker buttons, you can skip from marker to marker.
 Jump to the left-most data run marker.
 Jump to the previous (next left) data run marker.
 Jump to the next (next right) data run marker.
 Jump to the right-most data run marker.
See also
- Viewing the Watch Window as one plot or split plots
- Stopping the plot from scrolling in the Watch Window
- Inverting the y-axis of plots in the Watch Window
- Showing/Hiding a plot line in the Watch Window
- Automatically generating the best range for plots in the Watch Window
- Changing the horizontal or vertical plot resolution
- Understanding when data points are connected with lines in trend plots
- Changing plot line colors in the Watch Window
- Changing the update interval for blocks and groups in the Watch Window
- Controlling Data Display in the Watch Window
- Preventing pink-colored out of range data from appearing on Watch Window plots
- Setting a plot display start time
- Setting the plot font size