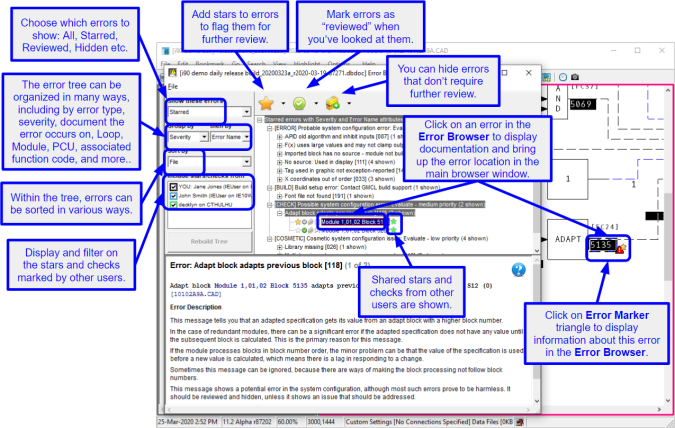
About the Error Browser
The Error Browser allows you to easily examine the error messages generated when you build a DBDOC project. It allows you to easily locate the sources of errors in the graphics and configuration, and methodically flag errors, mark them as reviewed, and hide them once they are dealt with or determined to be unimportant. Marking errors in these ways is persistent across project builds, so if for example you hide a whole category of errors, it will stay hidden when you look at the errors associated with a later build of your project.
Opening the Error Browser
To open the Error Browser:
- Click the Error Browser button
 on the toolbar.
 - Press E on the keyboard.
- Select Error Browser from under the View menu.
Overview of Error Browser features
Examining errors with the Error Browser
The errors DBDOC detects during a build are displayed in a tree structure in the error browser. Click on hyperlinks in the tree to instantly display the relevant error location in your project file. A brief explanation of each error (often with additional links) is also displayed in the Error Browser, and complete error documentation can be brought up with a single click. For more information see Examining errors with the Error Browser.
Reviewing, starring, and hiding errors in the Error Browser
Errors in the tree can be marked in various ways. They can be "Starred" to indicate that they need attention. They can marked as "Reviewed" to indicate that they have been examined. And they can be "Hidden" if it has been determined that they do not need to be seen again. Errors can be marked in these ways individually, or entire groups of errors (branches of the error tree) can be selected and marked all at once. These markings can be used to control what errors are displayed in the browser. For example, if you star some errors, and then set Show these errors to "Starred" only the starred errors will be displayed in the error tree. For more information, see Reviewing, starring, and hiding errors in the Error Browser.
Filtering, grouping, and sorting errors in the Error Browser
The Error Browser provides many convenient ways of filtering and organizing the error tree to make it easy to identify errors you are interested in. Errors can be displayed according to their severity. They can be organized according to what PCU they occur in, or what file they are associated with. You can hide certain errors, or show only errors that you have not already reviewed. For more information, see Filtering, grouping, and sorting errors in the Error Browser.
Exporting error reports from the Error Browser
The Error Browser can export plain text error reports. These contain the text of each error selected, grouped and sorted in the same way as in the Error Browser. If the errors are grouped by Error Name or Error Code, then the reports also include the summary information about each error type which is usually displayed in the bottom pane of the Error Browser. For more information, see Exporting error reports from the Error Browser.
Sharing error information with other users
If you register for data sharing, you can share your checks and stars with other users, and see their checks and stars in your error browser. This makes it easy to efficiently share the work of reviewing and evaluating errors with other members of your team. For more information, see Sharing error stars & checks with other users.
Error Browser roadmap

See also
- Filtering, grouping, and sorting errors in the Error Browser
- Choosing which errors to show in the Error Browser
- Specifying the error tree hierarchy in the Error Browser
- Sorting errors in the Error Browser
- Examining errors with the Error Browser
- Reviewing, starring, and hiding errors in the Error Browser
- Sharing error stars & checks with other users