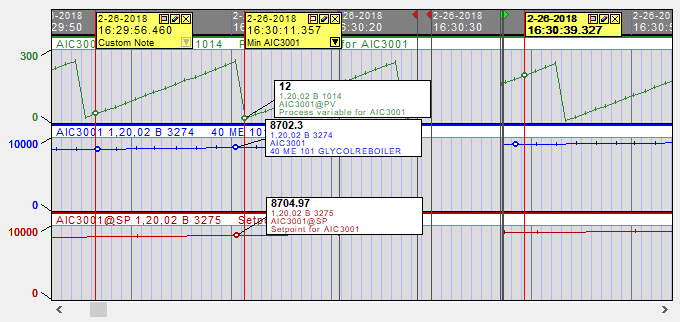
Timestamps display labels of the data values at the marked time. These value labels may obscure other parts of the plot. You can hide them so that you can see the data that they might be hiding.

To hide or show the value labels for a single timestamp, do one of the following:
- Click the value label toggle button (the small flag) in the yellow box at the top of the timestamp.
- Right-click the yellow box at the top of the timestamp. On the menu that appears, click Hide Value Label or Show Value Label.
To hide or show the value labels for all the timestamps in a watch group, do one of the following:
- On the View menu, click Timestamp Value Labels. Then click Hide All or Show All.
- Right click the group tab. On the menu that appears, click Timestamp Value Labels. Then click Hide All or Show All.
See also
- Navigating between timestamps in the Watch Window
- Creating and deleting timestamps in the Watch Window
- Marking Times with Timestamps in the Watch Window
- Using crosshairs cursor mode (View Mode) to browse data and create timestamps
- Adding notes to timestamps